The Effects of Congruency Between Structural & Contextual Dominance in Image Processing |
The Effects of Congruency Between Structural & Contextual Dominance in Image Processing |
*W(EXP) =.5736 & W(FR-S)(CG-S)(NCG-S) of <.6884
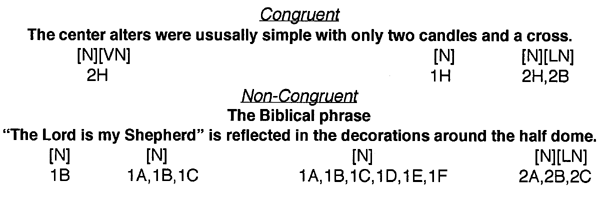
The first "object" encountered in this image is the "floor alter", which is referred to in the congruent condition's contextual cue. A focus on sector H would reinforce a congruent condition. The non-congruent contextual cue refers to the mosaic illustration above the center window, which is the largest graphic element in the image, as well as the largest architectural element (the half-dome in sectors A,B, & C). Due to the complexity of this image, it was anticipated that the contextual effects would be strong predictors of the eye-fixations.
*W(NCG-S) =.7590 & W(EXP)(CG-S) of <.5718 & W(FR-S) =.4633
Results for Image #8
Graphic Summary for Image #8 (figs. 1-3)


Verbal Summary for Image #8
Strategies and Anticipated Results
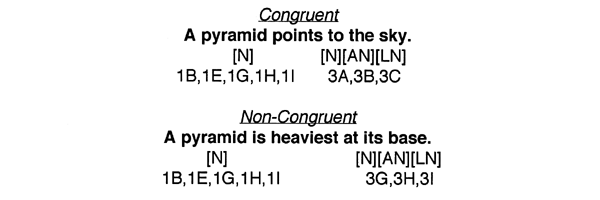
From a visual convention standpoint, a triangle is one of the three basic graphic shapes (the others are a circle and a square). This shape also is utilized as the head of an arrow which implies direction toward the tip (which would emphasize sector B if structural dominance is strong). The triangle was rendered in outline form so as to highlight the space inside the shape as well (sector E). The contextual cues were designed to emphasize the top in the congruent condition and the bottom in the non-congruent condition in the anticipation that fixations would dominate these sectors if there was a strong contextual dominance effect.General Stimulus Event Comparisons
Ranking of sector preference was significant beyond the .01 level for all data groups. Uniformity of image processing was moderate for the Expert data group, as well as for all experimental groups.Congruency Comparisons
The Degree of Congruency (°CG) between what the Experts identified as structural strengths in the image and how the Free-Viewing data group viewed the image was moderately strong, °CG(EXP|FR-S)=81. The match between the Free-Viewing data group and the Congruent data group was moderate, °CG(FR-S|CG-S)=54, and the match with the Non-Congruent data group was moderately strong, °CG(FR-S|NCG-S) =72.Structural & Contextual Dominance Comparisons
A very strong Congruency effect was evident in the Congruency data group with this image. Nearly 90% of all fixations were accumulated in sector B (DB(CG-S) = 89%). The Structural effect, in the Non-Congruent data group, was strong enough to draw enough attention from the contextually dominant sector H producing a strong attention to sector B also (DB(NCG-S) = 43%). There was some contextual effect evident in the Non-Congruent data group, evidenced by attention to sector H (DH(NCG-S) = 29%), compared to no significantly dominant fixations appearing in sector H for the Free-Viewing data group (DH(FR-S) = 0%).
Results for Image #14
Graphic Summary for Image #14 (figs. 4-6)


Verbal Summary for Image #14
Strategies and Anticipated Results
This image is the only "realistic" photograph of the 15 images. The picture was taken from the point-of-view of someone standing in the center of the room at an eye-level of the second alter. This angle accentuates the architectural perspective lines which converge just under the center window. These perspective lines alone were expected to draw strong fixations to sector E.General Stimulus Event Comparisons
Ranking of sector preference was significant beyond the .01 level for all data groups. Uniformity of image processing was moderately high for the Non-Congruent data group, moderate for the Expert and Congruent data groups, and low for the Free-Viewing data group.Congruency Comparisons
The Degree of Congruency (°CG) between what the Experts identified as structural strengths in the image and how the Free-Viewing data group viewed the image was high, °CG(EXP|FR-S)=83. The match between the Free-Viewing data group and the Congruent data group was high, °CG(FR-S|CG-S)=82, and the match with the Non-Congruent data group was moderate, °CG(FR-S|NCG-S)=69.Structural & Contextual Dominance Comparisons
A weak congruency effect was evident in the Congruent data group in sector H (DH(CG-S) = 38%). A strong contextual effect was evident in the Non-Congruent data group in sector B (DB(NCG-S) = 40%). A definite focus on the center of the image was evident in the Free-Viewing data group (DE(FR-S) = 43%). Similar to the preceding image, if in fact the actual structural dominance for image 14 is in sector E, as is evidenced by the Free-Viewing data group, then both the Congruent and Non-Congruent data groups demonstrate contextual effects rather than congruency effects. However, it may also be said that both groups represent partial congruency effects, since both sectors B and H represent secondary and tertiary structurally dominant sectors.Between Image Results
The 15 image stimuli presented were grouped into 3 subgroups; 5 simple, 5 moderately complex, and 5 complex images. The Kendall Coefficient of Concordance measures the uniformity of the subjects' responses. The Kendall W (W ) is a rating as to how similar each subject's response was to other responses such that if they were identical, the W would be 1. Figure 8 illustrates the general decrease of uniformity of the experimental groups as the complexity of the image increased.
http://silver.ucs.indiana.edu/~appelman/D_FOUR.html
 |